RESULTS / CASE STUDY / DTC Equestrian Apparel
Maximilian Equestrian
Online sales EUR 2.28M to EUR 4.54M in a year, the US$2.5M to US$5M+ pair shown elsewhere on this site, and a first seven-figure month.
Maximilian Equestrian, in Madrid. In July 2024 Google was almost all brand search: 1% of Performance Max spend reached Shopping, and Meta was remarketing to people who had already bought. The store was already growing when we arrived; the claim here is the change in what the ads bought, not the headline percentage.
Want this run on your account? Apply for a free 30-minute Strategy Call.
Where they started
"I don't care if ROAS is 10. It doesn't give me anything. 80% of those people would buy anyways. So I'd rather save that money and put it into meta."
Maximilian Equestrian makes premium riding apparel for women, men, children and their horses. Alex Arroyo Baudet co-founded it, runs paid media himself, and his co-founder runs product and operations. On the first call, 11 July 2024, he put spend at about EUR 25K a month, 85% Meta and 15% Google. The ads were already working. The online store had done EUR 981,863 in 2023 and EUR 1.16M in the first eight months of 2024.
Two things bothered him. Google 'has had a very slow start', with product-feed and store-integration problems: 'it's just been a nightmare'. He knew it was almost entirely brand search, 'which I'm not happy at all about'. Six weeks later the agency was gone. A payment issue had stopped the ads and 'it ended up being like 48 hours without ads being active' before anyone noticed.
He was also a skeptic of agency talk. On 11 July he said: 'Everything we say now is purely words. There's no real proof to anything.' So instead of a pitch we wrote him a Growth Audit of both ad accounts, at no charge. That was the version we ran before the diagnostic became the paid, 14-day Profit Clarity Audit. He granted Meta access the same afternoon.
What the audit found
We wrote the Growth Audit on 17 July 2024 and walked Alex through it on a recorded 74-minute call the next morning. It covered the website, email, Meta and Google. The diagnosis in one line: both accounts were buying demand the brand already had and reporting it as growth. The two levers that create new demand, Google Shopping and Meta new-customer acquisition, were broken or switched off.
On Google, one broad 'branded' campaign mixed brand and non-brand terms, and every recent conversion in the Performance Max campaign was a branded query. Only 1% of its spend reached Shopping because of problems with the product feed. On Meta, a traffic campaign was optimising for landing-page views, the best-ROAS campaign was paused, and the Advantage+ campaign had no engaged or existing-customer audiences defined. So Meta was quietly remarketing to people who had already bought.
Alex held off in July. Six weeks later he had let the agency go and wrote that he was 'in talks with a couple of new ones'. He signed on 4 September 2024, for Meta and Google together. The bullets below are quoted from the audit document word for word, and the Google Ads and Meta Ads sections are shown as exported from the Google Doc.
- You're currently basically only targeting "branded" search and people who are already deep down in the funnel and actively searching for your brand
- That means, if you would turn off all the google ad campaigns, most of those $30k in revenue would probably happen anyways
- For you, it seems like there are some issues with the Shopping Feed
- And therefore only 1% of the spend goes towards shopping
- Turn off traffic campaign focusing on "Landing Page Views"
- I don't understand why the "bottom_performers" campaign, which had the best ROAS and lowest CPA was paused
- You should definitely define "engaged" audiences and "existing" audiences
- With a lot of the ads you're sending people to the homepage - which you should almost never do
- The headline is always just "SHOP NOW" - I would definitely test something more unique and something that stands out a bit more
What we did, in order
- Jul 2024The Growth Audit, at no charge. Both accounts were buying demand the brand already had: Google on brand search, Meta on people who had already bought. Alex held off for now.
- Sep 2024Signed 4 September, and Google rebuilt around non-brand search and Shopping. A new account, a new product feed on DataFeedWatch, and English and Spanish ad copy.
- Oct 2024Alex sent proof on 1 October that a wholesale order was firing Meta's purchase pixel. We reconciled order by order the same day and back-tested it to a third of Meta's reported revenue across sampled days. Split out with a separate 'Purchase Only Wholesale' conversion on 10 October, so those orders left the reporting.
- Oct-Nov 2024The wobble, then the turn. On 15 October non-brand Google still looked bad internally. By 29 October MER was up 56% on lower spend, with non-branded Google driving sales for the first time.
- Aug 2025Wrote the scale, hold and cut rule before the Q4 push. Above a blended ROAS of 5 scale 10-20% a week, between 4 and 5 hold, below 4 cut.
Full engagement log, September 2024 to January 2026
- 9-11 Jul 2024Alex answers a cold email: 'Do you have any experience within the equestrian world?' First call two days later, 35 minutes, recorded. We offer to audit both ad accounts at no charge; Meta Business access is granted the same day. The brand was founded in 2018 and has run from Madrid since 2022. In July 2024 it advertised in about 15 countries and sold roughly half to retailers, half direct to consumers online.
- 17-18 Jul 2024Growth Audit written and walked through live on a recorded 74-minute call: Google, Meta, website speed, email. Alex holds off for now.
- 27 Aug - 6 Sep 2024Alex writes that they have 'stopped working with our previous agency entirely'. Close call 30 Aug, agreement signed 4 Sep, store and ad-account access from 5 Sep.
- 5-13 Sep 2024Onboarding: DataFeedWatch installed on the store, plus Merchant Center and GA4 access. Then market research, a buyer persona, keyword research, a new Google search structure and English and Spanish ad copy. Alex, 13 Sep: 'The list with Google Ads copies looks good, it's very extensive. Happy to proceed with it'.
- 20 Sep - 2 Oct 2024New Google Ads account launched. Meta catalog moved off the old agency's feed platform, whose scheduled uploads were failing, onto DataFeedWatch with per-country, per-currency product sets.
- 1 Oct - 6 Nov 2024Wholesale discovery. Alex sends proof that a wholesale order shows up as a Meta purchase. We reconcile order by order the same day: 5 of 29 reported orders were wholesale, half the reported value. A back-test runs across nine sampled days, 6 February to 1 October 2024; in the sheet's own total row 33.48% of Meta's reported value is wholesale. A separate 'Purchase Only Wholesale' custom conversion goes live 10 Oct so those orders drop out of reporting.
- 15 Oct - 12 Nov 2024The honest wobble, then the turn. On 15 Oct, internally: non-brand Google 'still doesn't look good at all'. On 29 Oct: MER up 56% on lower spend, non-branded Google driving sales for the first time (US PMax 4.6x, Spain 4.2x). Google simplified to one Performance Max per market with five asset groups plus separate branded search per market; Spanish campaign relaunched with Spanish copy.
- 7 Nov - 1 Dec 2024Black Friday system: written paid-media strategy, Meta account structure, client checklist, competitor swipe file. Black Friday weekend: EUR 10,542 spend, EUR 126,118 revenue, MER 11.96, Meta ROAS up 30.66% on the previous Black Friday.
- Dec 2024 - Mar 2025Tracking investigation catches 11 more wholesale orders (EUR 34,590) slipping through; exclusion rules added. Country analysis, a direct Google EMEA strategist line, competitor research, a CRO audit and a site-speed analysis. Fixed weekly Tuesday call with both media buyers from February 2025; Slack channel from 21 Feb.
- May - Jun 2025Scaling strategy: Europe split into country campaigns, Germany given its own budget, PMax asset groups rebuilt by performance. Triple Whale set up. The brand launches Shopify Plus and a separate B2B store on 6 Jun, taking wholesale off the DTC pixel for good.
- Aug - Nov 2025Decision Making Criteria doc (11 Aug): blended ROAS above 5 and nCAC at or under EUR 70 means scale 10-20% a week, 4-5 hold, below 4 cut. Jumpsuit launch 28 Aug is the third-best revenue day of the year. Q4 forecast models the 100% YoY goal at EUR 300-380K spend. Black Friday 11 Nov - 1 Dec. First seven-figure month confirmed 1 Dec: EUR 1,000,156.84.
- 16 Dec 2025 - 8 Jan 2026Alex gives notice to bring paid media in-house from 4 Jan 2026. Final strategy call 19 Dec, last call 30 Dec. Google and Meta handover documents delivered 2 and 5 Jan; DataFeedWatch account (47 feeds) transferred 8 Jan.
What happened
What Meta reported, and what the reconciliation showed
Matched order by order against Shopify order IDs, the days in the sheet's total row gave back a ROAS of 2.93 against Meta's 5.03. Source: HoloGrowth reconciliation sheet, Oct 2024.
Wholesale orders keyed in by staff in Madrid were 33.48% of the reported purchase value on those days.
How much of Meta's reported purchase value was wholesale, by sampled day in 2024
Meta-reported conversion value matched to wholesale orders in Shopify. The sheet's own total row covers the sampled days from 16 February to 27 September 2024: 33.48% wholesale, and a reported ROAS of 5.03 that reconciles to 2.93. Source: HoloGrowth reconciliation sheet, Oct 2024.
Every figure on this page is whole-store, not attributed, and in EUR unless the screenshot says USD. The sources are Shopify Analytics, the weekly Performance Reporting sheet fed by Shopify, Meta and Google, and the YoY Growth document. We presented that document to Alex on the recorded 19 December 2025 call. Alex launched most of the Meta ads himself. The brand moved to Shopify Plus and ran its own email and launch calendar. An August 2025 riding jumpsuit became a bestseller on launch.
The first 90 days
The first 90 days are the cleanest read available. Before we started, the online store was already running +142.6% year on year. That is EUR 1,157,714 in January-August 2024 against EUR 477,210 in the same months of 2023, from the Performance Reporting sheet. Inside our first 90 days it held at +142%, on 64% more sessions and a conversion rate up 48%, while total sales including wholesale grew 103%. From 13 September to 11 December 2024, Shopify total sales were EUR 1,416,360. Non-brand Google produced sales for the first time in month two: on 29 October we reported MER up 56% on lower spend. Black Friday weekend 2024 did EUR 126,118 of revenue on EUR 10,542 of ad spend. The claim we will defend is the mix change, not the headline percentage. Our first four months of online-store revenue ran +281%, +143%, +121% and +207% year on year, on the online store alone.
The scale year
2025 was the scale year. From 1 January to 16 December, online sales went from EUR 2,281,657 to EUR 4,536,293 (+99%) while ad spend went from EUR 339,040 to EUR 925,631 (+173%). Google alone went from EUR 51,850 to EUR 233,444. The 16 December cut-off is the date of the YoY Growth document we presented on 19 December. On the full calendar year the online store did EUR 4,716,320 against EUR 2,460,489, which is +92%. The last two weeks are the December problems described below. From August 2025 the account ran on a written rule: scale only above a blended ROAS of 5, hold between 4 and 5, cut below 4. The rule existed so a falling MER could not quietly become falling profit.
November 2025 was the first seven-figure month: EUR 1,000,156.84 in Shopify total sales, up 36% on November 2024, with online sales up 67%. The 100% goal was not reached. In the final week Alex chose stability over a last budget push: 'I wouldn't touch Meta's budget anymore'. December was hard. The warehouse fell a week and a half behind after a three-week sale. A returns-app error was corrected in one batch of refunds on 22 December, and online growth slowed to +18.5% for the month.
What it cost
Online MER fell from 6.73 to 4.90 while ad spend rose 173%. Put the other way round, ads went from 14.9% of online sales to 20.4%. Lower efficiency for double the revenue was the plan, and whether that trade paid depends on contribution margin, which is the brand's number and not ours. We run every engagement on five numbers: CM3, nCAC, 90-day LTGP:CAC, payback, and the new-versus-returning split. Here, nCAC was tracked weekly against a EUR 70 threshold and the new-versus-returning split sat in the weekly report. The other three are the brand's internal accounting and stay with the brand. So does our fee.
What Google returned
Google spend going 4.5x is an input, so here is the output attached to it. This one is platform-reported rather than whole-store. Google's own reporting for 1 September to 5 October 2025 shows EUR 152,927 of conversion value on EUR 22,822 of spend, a 6.70 ROAS. Branded search took EUR 1,769 of that spend, 7.8%, against the handover rule of 10-15%. Non-brand Performance Max took EUR 19,685 and returned EUR 100,267, a 5.09 ROAS. It produced 301 of the 418 new customers Google recorded in those five weeks.
Online store sales by month: 2023, 2024 and 2025
EUR per month, Shopify online store only, wholesale excluded. Years: EUR 981,863 / 2,460,489 / 4,716,320. Source: Performance Reporting sheet, YTD Summary tab
The same 13 weeks one year apart: fiscal weeks 36 to 48
Online store sales per week, EUR. Week 36 starts 2 Sep; weeks 46-48 are the Black Friday sale. 13-week totals EUR 991,646 (2024) and EUR 1,740,899 (2025). Source: Performance Reporting sheet
Ad spend by platform: total up 2.7x, Google up 4.5x
EUR, 1 Jan-16 Dec. All-platform spend went from EUR 339,040 to EUR 925,631 (+173%). The bars show Meta and Google; the remainder, EUR 5,475 in 2024 and EUR 41,808 in 2025, sat on other platforms. Source: YoY Growth document, 16 Dec 2025.
What the business became
Google was the channel Alex would not fund in July 2024. By 2025 it ran one Performance Max campaign per market, with branded search split into its own campaigns. The handover rule was that branded stays below 10-15% of account spend.
For Alex the change was what he could think with. He launched most of the ads himself, and two things changed how he decided. The written decision rule is what let the Q4 ramp, the largest spend block of the year, happen without a fresh argument every week. The separate B2B store, live on 6 June 2025, took wholesale off the DTC pixel for good. A fixed weekly hour with both media buyers, reporting by market, quarterly forecasts and a Google EMEA line came with the engagement.
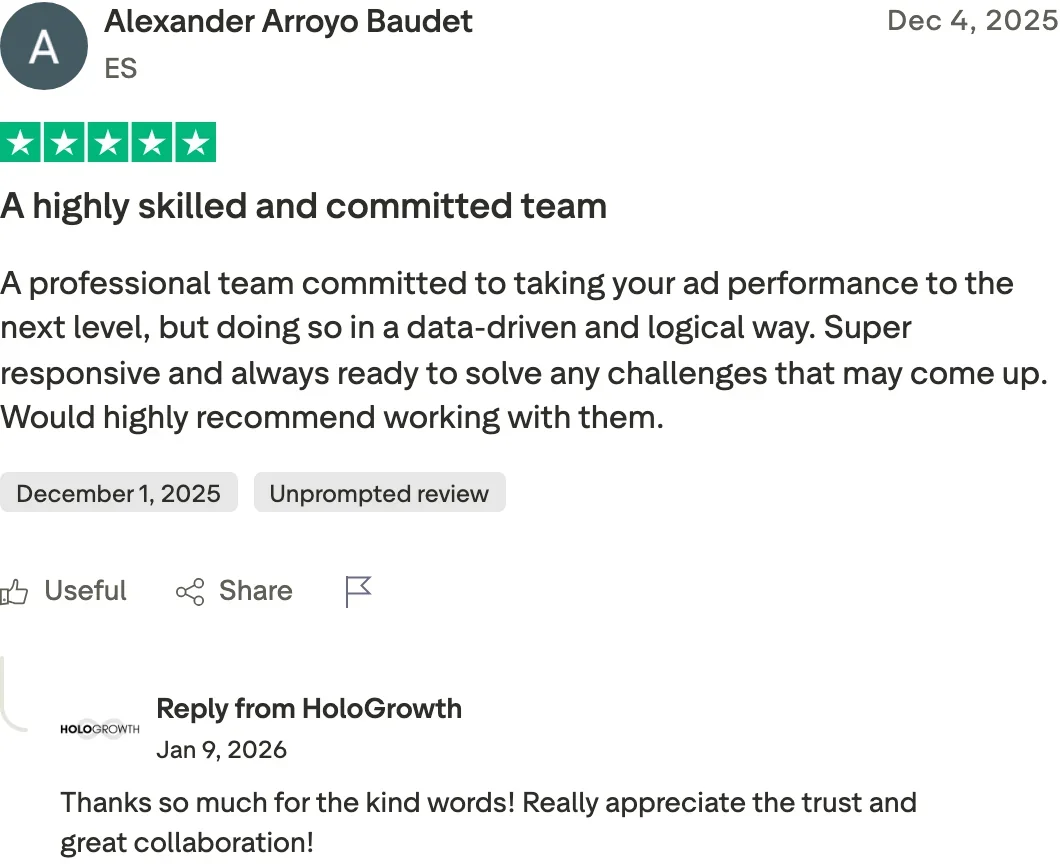
The ending, plainly. On 16 December 2025 Alex gave notice to bring paid media in-house, with a new hire and AI tools, from 4 January 2026. He said on the final strategy call three days later that the decision had no relation to being dissatisfied with the work. Handover documents for both platforms went over in the first week of January. Twelve days before giving notice he left the review below on Trustpilot, two days after we sent him the profile link.
"A highly skilled and committed team. A professional team committed to taking your ad performance to the next level, but doing so in a data-driven and logical way. Super responsive and always ready to solve any challenges that may come up. Would highly recommend working with them."
Want to know what this would look like on your numbers? Start with a free 30-minute Strategy Call. We look at your dashboards live and tell you honestly whether the $5,000 Profit Clarity Audit is the right next step. Two guarantees, both yours to claim. One: if we cannot quantify $75K of annual profit upside, the full $5,000 becomes a credit against any engagement. Two: if you do not think it was clearly worth it, we refund 100%, no conditions.
What you can take from this
Verify this case study
- The Growth Audit is a Google Doc created 17 July 2024, walked through on a recorded 74-minute call the next morning. Two of its sections are shown above as exported, and every bullet is quoted from it word for word.
- The Shopify screenshots come straight from the store: the first 90 days in EUR, and calendar 2025 vs 2024 in USD. The USD view is two crops of one screenshot, with a red box we added on the Online Store row.
- The EUR figures come from the YoY Growth document presented on the recorded 19 December 2025 call. The monthly and weekly series come from the Performance Reporting sheet, and the wholesale figures from our order-by-order reconciliation across sampled days in 2024.
- Alex's review is public on trustpilot.com/review/hologrowth.com and carries Trustpilot's 'Unprompted review' label. It did not come from an invitation email; we sent him the profile link on 2 December.
- See the ads themselves in the Meta Ad Library.
- Numbers on this page last updated 2026-09-08.
Run the same math on your own account
Every HoloGrowth engagement starts with the same five numbers. They are CM3, nCAC, 90-day LTGP:CAC, payback, and the new-versus-returning split. The free Scaling Scorecard gives you those five metrics with the exact scale/hold/fix/kill thresholds we use on managed accounts. You see the same picture before you ever talk to us. If you only want to run one number first, find the point where your next dollar of spend stops being profit with the ad spend ceiling calculator.
Get the Free Scaling ScorecardFind out how much of your ROAS is customers you already had.
It starts with a free 30-minute Strategy Call. We open Google and Meta live and split brand search and remarketing from new demand. Then we decide together whether the $5,000 Profit Clarity Audit is the right next step. Two guarantees, both yours to claim. One: if we cannot quantify $75K of annual profit upside, the full $5,000 becomes a credit against any engagement. Two: if you do not think it was clearly worth it, we refund 100%, no conditions.