RESULTS / CASE STUDY / Australian-made knives
Iron Gate Knives
Iron Gate Knives makes Australian hunting, fishing and kitchen knives in Anna Bay, NSW. In February 2026 founder Izac Yeaman was buying his own ads and did not trust the numbers. This page is about what that one-person shed operation looked like seven months later.
Where they started
Izac Yeaman started making knives in a shed during COVID. By February 2026 the business was about a year and a half old and doing around A$100K a month. Almost all of it came from Meta ads and organic Instagram he ran himself. Calendar 2025 had closed at A$551,883 on Shopify, with A$146,711 of that in the Black Friday month.
The ads were working, in his words, 'decent'. But he could not tell what was true. Google Ads had been abandoned after the weapons policy rejected his hunting-knife ads. Meta was, in his own email, 'a complete and total mess': boosted posts and traffic campaigns. The biggest-spending one had sent about 28,000 clicks to the site with zero purchases.
Production was the other ceiling. The workshop was a garden shed, a bigger one was four weeks from being built, and he wanted stock ready before spend went up. So the first month was planned as a rebuild on small budgets while the workshop moved.
Iron Gate came in below the spend level we normally take on. The standing bar is $30K+ a month in ad spend. We made an exception because the constraint was diagnosable in a week and the founder controlled every lever himself. Those are the two conditions that make an exception worth it. It still spends below the bar and we still run it, because the ceiling here has always been production capacity. If you are under $30K a month in spend, say so on the call.
The February numbers, from the reporting sheet we built in March and back-filled: A$111,864 of revenue on A$22,793 of ad spend, all of it Meta, so 4.9x blended. 163 new customers at about A$140 each. A store conversion rate of 0.22% on 100,622 sessions.
"I just don't really know what it is I should be tracking... I also don't really trust the data sometimes... it's like I don't really know what's true and what's not. I think all these marketing agencies love to tell you that they're making you rich, but they might not actually be doing as much as I think they're doing."
What the audit found
The audit was written on 19 February 2026 and walked through with Izac on a recorded 63-minute call the same evening, with the ad account open on screen. Andrej on tape: 'it's one of the messiest ad accounts that I've seen in a while.' On the biggest campaign of the previous 30 days: 'It had like 28,000 link clicks. But from that, not a single person has purchased.'
The document named one constraint and ranked five. The constraint sat upstream of the creative. Sold-out best sellers and pre-order pages meant a large share of paid clicks landed where buying was impossible. That crushed the store's conversion rate and taught Meta the wrong lesson about good ads. The findings below are copied from the document as sent.
It also set the Google path in writing before a dollar was spent. Brand search first, then non-weapon utility keywords such as fillet and chef knives, with cooking and fishing imagery. Izac accepted the plan on the call: 'the spaghetti on the wall was not cutting it. But yeah, you're the man for the job.'
The headings below are the audit's own shorthand for this account, not verdicts on the platforms.
- Growth is capped because your drop/preorder inventory model and your acquisition system are misaligned. You're generating cheap attention, but you don't have a clean, trackable path that reliably converts that attention into purchases (or high-intent waitlist revenue) at scale.
- Constraint #1 (Highest Impact): Demand capture is broken because inventory state (sold-out/preorder) isn't handled as a funnel
- It creates "false negatives" in ads: good creative → click → sold out → no purchase → platform learns the wrong lesson.
- Constraint #2: [The] Meta [account] is not built for learning or conversion
- The account has many active campaigns, boosted posts, and traffic/LP-view objectives - that buys clicks, not customers.
- Without guardrails, scaling becomes emotional (confidence-based) rather than rules-based.
- You already hit policy friction. Your path is: avoid weapon framing and build campaigns around kitchen/cooking + utility + accessories.
- You don't have a "marketing" problem. You have a demand capture + system design problem: cheap attention is available, but the business lacks a clean, trackable path that turns it into purchases (or high-intent drop revenue) reliably.
What we did, in order
- 9 Feb 2026Discovery call, recorded. Izac's booking form had said: 'Not really tracking much, just doing TOF ads and it's working decent.' On the call he said he did not know what to track or what to trust.
- 19 Feb 2026Audit delivered and walked through live on a recorded 63-minute call. One constraint named and five ranked, with the Google path set in writing. This was our pre-engagement diagnostic, delivered free and later rebuilt as the $5,000 Profit Clarity Audit. The paid version does the same diagnostic work shown here, and adds the outside-platform metrics layer, cohort LTV and contribution margin by product, and a 90-day plan. Izac accepted the engagement price on the call.
- 9 Mar 2026 (week 11)Meta rebuilt: boosted posts and click objectives switched off, three purchase-optimised campaigns for testing, scaling and catalog. Google launched from A$0 with a A$10-a-day policy-validation campaign: A$41.87 spent in week one, six conversions on A$180 the next week.
- Apr to May 2026Google split into Hunting/Outdoor and Fishing/Kitchen campaigns to work around 'hunter' disapprovals; branded Performance Max added. Budgets moved with Izac's stock signals: A$600 a day over Easter on his instruction, then 'as long as we stay above 5x'. Team of five confirmed by Izac on 12 May.
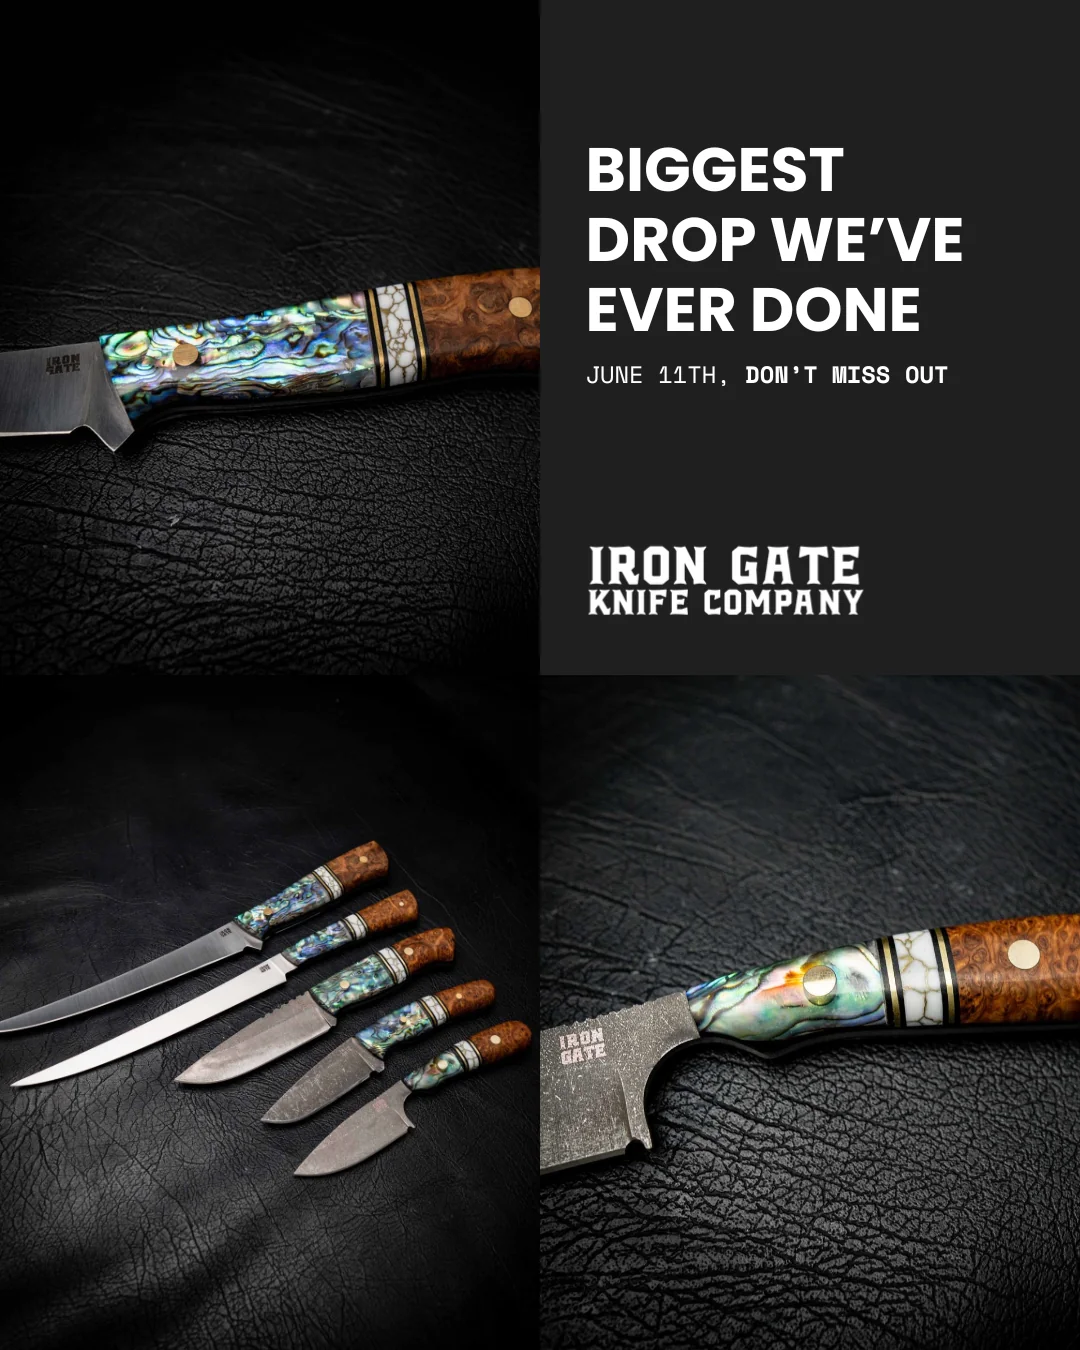
- 27 May to 28 Jun 2026Landing-page test: Home, Collection, Pre-order and Built-to-Order. June creative review: 80 creatives were live, 14 were performing and 8 were solid. 57 of the 80, 71% of everything running, had produced no purchases at all. The 11 Jun 'biggest drop we have ever done', then the EOFY sale: record week 22 to 28 Jun.
- 18 Jul to 5 Aug 2026Two-week standard versus incremental attribution test on matched spend. Standard won on every basis, so the incremental campaign was switched off. Google settles into double-digit weeks: 11.79x in the week of 27 Jul and 12.73x in the week of 10 Aug, on the sheet's rows.
Full engagement log, 9 February to 31 August 2026
- 12 to 18 Feb 2026Access to Shopify and Meta granted. Izac emails that Google was abandoned after weapons-policy rejections and that his Meta strategy is 'a complete and total mess'. Several Australian agencies had quoted; he wrote that HoloGrowth was 'number 1# at the top of our list'.
- 25 Feb to 2 Mar 2026Contract signed during the onboarding call on 25 Feb; Slack channels opened. Access set-up call on 2 Mar: Meta Business Suite cleaned up, Google Ads, Merchant Center and Analytics linked. His onboarding form gave the baseline: break-even ROAS '3.5+', 60% of sales from ads, CAC 'I'm not fully sure yet'.
- 2 to 20 Mar 2026Research and strategy pack: a 300-step CRO audit, market and competitor research, and a creative brief. Then a Meta strategy with Test, Promote and Scale lanes on fixed budget shares, and a compliance-first Google Ads strategy. Reporting sheet built on 10 Mar, fed by Shopify, Meta and Google every week.
- 19 Mar 2026First performance call. Izac on tape: 'somehow you guys are getting more efficient with ads... massive confidence booster', and 'Google Ads is definitely a game-changer'.
- 29 Jun to 21 Jul 2026Izac asks to cut spend ('$250 a day for a week or two') while the team catches up on orders and finishes the showroom. The account is stepped down to about A$400 a day, with every campaign above 5x. Meta weapons-policy rejections peak: 2 of 12 new ads approved on 13 Jul. Kitchen-knife ads become the approval-safe lane.
- 13 to 31 Aug 2026Bi-weekly calls agreed. Organic-first creative loop: Izac films phone content weekly, the top reels are tested as ads within 48 hours. Izac asks to manage the account on metrics 'that can't shift with attribution windows': blended MER, new-customer CAC, new-versus-returning revenue. COGS loaded into Shopify on 26 Aug and a break-even calculator on his own cost of goods added to the weekly sheet.
What happened
Every number here is blended unless it says platform. Blended means all Shopify revenue over all ad spend on Meta and Google. It comes from the weekly reporting sheet that Shopify, Meta and Google feed.
The first month proved the mechanism. Spend was cut 43% on purpose, from A$22,793 in February to A$12,951 in March, while the workshop moved. Revenue dipped 12% to A$98,879. New customers rose 31%, from 163 to 214, and the cost of each fell from about A$140 to A$60. The store's conversion rate went from 0.22% to 0.83% as the boosted-post traffic was switched off and sessions fell by two thirds. It has held between 0.64% and 1.02% since, so the growth after March came from order volume on a roughly steady rate.
Then the account grew with production. Google went from A$0 to 51% of paid spend by August, at 7.96x on the sheet's Overview row. Izac saw it as 'bigger than Meta' in Shopify's source view. June took A$248,524, the highest month on record, carried by a birthday drop and the EOFY sale week at A$82,852 on A$6,475 of spend. May took A$142,956 on its ordinary weekly drop cadence. July, the month spend was deliberately cut to about A$400 a day, still took A$149,946, and August took A$161,447 at 8.99x on a Father's Day push. Both beat the A$146,711 the brand did in November 2025, its Black Friday month.
Other things moved the numbers too. Izac makes most of the content himself and rebuilt the website himself in June. Stock decided the budget all year. Drops sold out in minutes, spend went down in July while orders were caught up, and up again for Father's Day and the showroom opening. Meta rejected many ads under its weapons policy from June, so kitchen-knife creative carried more of the load.
Two things this page does not claim. It does not claim a profit figure. The sheet does carry an after-everything number. Its True Total ROAS divides what is left after cost of goods, payment fees, fulfilment, ad spend and our fee by ad spend plus our fee. Cost of goods only started loading into Shopify on 26 August 2026, so that number cannot be read yet. Izac's own break-even on his onboarding form was 3.5x blended, and August ran at 8.99x. On the 5 May call Izac said the new workshop, about $150,000, was 'paid for and done' with money still in the bank. That is his figure, not one we can verify. It does not claim 'more spend' either: the founder set the ceiling from stock all year, and the win is what each dollar bought.
Weekly Shopify revenue and total ad spend, September 2025 to August 2026
Reporting sheet, Overview tab, one row per ISO week. Week 36 (31 Aug to 6 Sep 2026) left out: its order data is incomplete.
Weekly blended ROAS, September 2025 to August 2026
Recomputed from each week's revenue and spend in the Overview tab; the week of 29 Dec 2025 had no spend and is skipped.
Shopify revenue by calendar month, September 2025 to August 2026
Reporting sheet, Monthly tab, read 7 Sep 2026. Nov 2025 (Black Friday) A$146,711; Jun 2026 A$248,524; Aug 2026 A$161,447.
Store conversion, 2026: orders per 10,000 sessions, by month
Orders over sessions, from the sheet's Shopify daily tab. Feb 0.22% (100,622 sessions, 218 orders); Aug 0.82% (37,985 sessions, 313 orders).
Monthly paid spend by channel, March to August 2026
Platform-reported monthly spend from the sheet's Meta and Google tabs. Google passes Meta in August and takes 51% of the month's A$17,956.
What the business became
In February the workshop was a garden shed and the founder was maxed out. On 2 March he said on tape that he had hired another full-time knife maker. On 23 April: 'We have 4 guys in the workshop now'. On 12 May he corrected our draft: 'we have a team of 5 now. Andrew, myself (Izac), Callum, Brando and James.' James is the full-time videographer who started on 20 April.
By May the new workshop was built and, in Izac's own words below, paid for. The showroom was finished in July and opened to the public on 5 September. Weekly drops of 20 to 50 knives sell out in about 20 minutes, and the plan for October and November is drops of 500 to 1,000 knives.
The bigger change is how he runs the numbers. In February he did not know what to track. On 10 August he wrote to the team that he wanted the account managed to 'metrics that can't shift with attribution windows'. He named four: blended MER, new-customer CAC, new versus returning revenue, and contribution margin after CAC. Those now sit in his weekly sheet, and his workshop app prices every knife's materials and wastage as it is built.
The engagement is live as this is written, on bi-weekly calls, with the founder pushing spend up ahead of a price increase at the end of September.
"The fact that we're paid for this entire shed. We've spent $150,000 building it and everything's paid for and done. And we can still have money in the bank and pay salaries. Still blows my mind because like 18 months ago, like I didn't even know I could feed my kids with this business."
What we got wrong
The landing-page test we ran from 27 May to 27 June never finished. Two of its four arms, the Pre-order and Built-to-Order pages, lost their ads to Meta's weapons policy mid-test. Only two of the eight ads in the test survived review, so Home and Collection were the only pages that produced a readable result.
That cost a month, and the store-side question is still open. We should have validated policy approval on every arm before splitting spend, and that is how we run this test now.
Want to know what this would look like on your numbers? Start with a free 30-minute Strategy Call. We look at your dashboards live and tell you honestly whether the $5,000 Profit Clarity Audit is the right next step. Double-backed: 100% money-back if it wasn't clearly worth it, or the full fee becomes a credit if we can't quantify $75K in annual profit upside.
What you can take from this
Verify this case study
- Founder quotes: eight recorded calls with Izac, 9 Feb to 13 Aug 2026 (Read.ai), plus his emails and our shared Slack. The 5 May call was phone audio.
- All result numbers: the client's weekly Performance Reporting sheet, fed by Shopify, Meta and Google, read 7 Sep 2026. Week 36 excluded. Two Meta reporting automations stopped on 27 August, so the last five days of that month are the sheet's least certain rows. Platform ROAS is the platforms' own 7-day-click figure.
- The audit pages shown are the document sent to Izac on 19 February 2026, rendered from the PDF; the findings are quoted verbatim.
- The 28,000-click boosted post is Andrej's count from Ads Manager on the recorded 19 February 2026 audit call, for the 30 days before it.
- See the ads themselves in the Meta Ad Library.
- Numbers on this page last updated 2026-09-08.
Run the same math on your own account
Every HoloGrowth engagement starts with the same five numbers. They are CM3, nCAC, 90-day LTGP:CAC, payback, and the new-versus-returning split. The free Scaling Scorecard gives you those five metrics with the exact scale/hold/fix/kill thresholds we use on managed accounts. You see the same picture before you ever talk to us. If you only want to run one number first, find the point where your next dollar of spend stops being profit with the ad spend ceiling calculator.
Get the Free Scaling ScorecardIf your ads are buying clicks your stock cannot turn into orders, the platform is learning the wrong lesson on your money.
It starts with a free 30-minute Strategy Call. We look at your numbers live, name your most likely constraint, and tell you honestly whether the $5,000 Profit Clarity Audit is the right next step. Double-backed: 100% money-back if it wasn't clearly worth it, or the full fee becomes a credit if we can't quantify $75K in annual profit upside.