RESULTS / CASE STUDY / Premium Desk Furniture
BALOLO
Three Novembers, two years apart. The €1.5M is the headline; what happened to the nine ordinary months is the argument.
Where they started
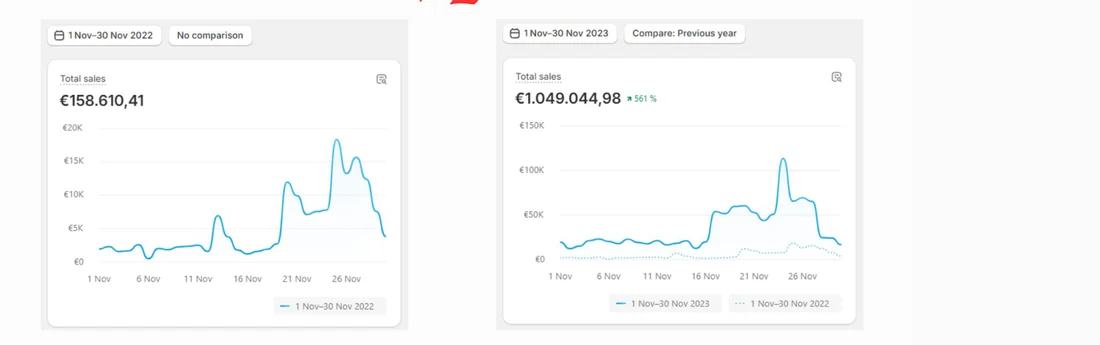
Every DTC brand with a good product eventually gets the month. The one where the graph finally does the thing. BALOLO got it in November 2022: €158,610.41 in total sales, the first six figures in the brand's history.
Then look at the shape of that month. Days 1 to 20 produced about a third of it. The last ten days produced the rest. The peak day is 25 November, Black Friday.
That business had a good November. What the chart cannot tell you is whether it could produce another one on purpose. A brand can have a month like that and still have no idea how to buy a customer in March.
The product was already right. BALOLO makes the Setup Cockpit, a modular monitor stand built on a patented grid. Every one is built by hand by master carpenters in North Rhine-Westphalia, in American walnut, oak or all-black steel. Somebody's hands are on each unit before it ships. We did not build any of that. We were hired in August 2022 to run the paid side of it, and BALOLO has been on the roster longer than anyone since. So that first six-figure month is already month four of the engagement. It is not a clean before, and we are not presenting it as one. Read that November shape again and the job is obvious: the other eleven months.
The constraint
Two thirds of that month arrived in ten days. They are the ten days the calendar hands to every DTC brand. That is what the chart shows, and it is the problem this page is about. On the shape of November 2022, the calendar was doing the selling.
Here is how much of that we can prove. The shape is measured off the screenshot above, so you can check it yourself. What we cannot put in front of you is the eleven months around it: that November is the only 2022 month we hold, our continuous monthly record for this account starts in August 2024, and no diagnosis from the 2022 growth period survives in our files. So read the calendar dependency as an inference from one chart, not as a finding we wrote down at the time - a problem worth solving whether or not it was the only one.
There is no shortage of people who want a hand-built desk system. The hard part is reaching them on a Tuesday in March, at a price the business can live with. Until that works, a year is one good month and eleven months of hope.
What changed
So the work had to make demand appear in the months the calendar was not handing over. That is a different job from making Black Friday bigger, and a harder one.
A Setup Cockpit is chosen the way a desk is chosen, not the way a cable is. In the last ten days of November that decision gets made for people, by a date - that is the two thirds of the month you just read off the chart. In March nothing makes it for them. What our records do not contain is what BALOLO ran on price in those ten days, so this page does not say.
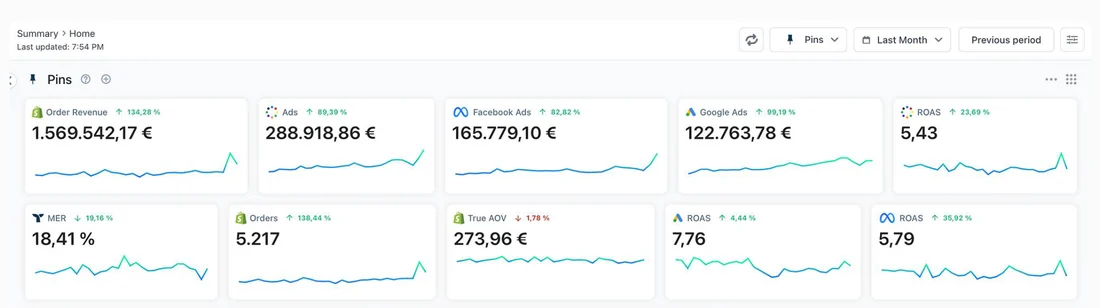
We ran Meta, Google, the strategy behind both, and the landing page work, from August 2022. Both channels had to carry real weight: in November 2024 Meta took €165,779.10 and Google €122,763.78 of the month's total ad spend, Google 42% of it. That split is measured in a Black Friday month, because that is the month we can show you, and it is not the off-season mix. What a platform reports back is also not what the business returns on the euro. That gap matters most when you are deciding how much you can spend: Why Your 8x ROAS Is Lying to You.
One caveat, because this page is asking you to believe a causal story. We ran the paid engine. We did not run the product, the brand's own audience, or its creator partnerships, and all three were working over the same two years. Nothing in our records says which of those channels came first, or which one moved which month, and the evidence does not line up neatly either: the two-channel split is one Triple Whale month, while the year-round figures are Shopify totals with no channel attribution attached. The page shows that both things are true. It does not show one causing the other.
What happened
<strong>€158,610.41 to €1,049,044.98 in twelve months</strong> - a 561% increase, and the brand's first seven-figure month.
<strong>€1,569,542.17 in November 2024 on €288,918.86 of ad spend</strong> - a blended 5.43X across 5,217 orders. That revenue figure is Triple Whale order revenue, not Shopify. Our own Shopify reading of the same month is €1,537,823. The verify block below reconciles the two.
<strong>October 2024 at €677,521 and December 2024 at €990,989</strong> - Shopify total sales. The €1.5M is one month, not a monthly rate.
<strong>€8,431,427 in the twelve months to July 2025</strong> - Shopify total sales. The three Q4 2024 months are €3,206,333 of it, on our Shopify reading of November throughout. The verify block reconciles that against the Triple Whale panel above.
That fourth line is the one worth sitting with. Take Q4 out and the other nine months still average about €580,000 each. The average of those nine months is more than three times the €158,610.41 month the brand celebrated in 2022. The weakest of them, June 2025 at €363,866, is still more than twice it. November is still the brand's biggest month, and 2024 was a Black Friday month too. But the ordinary months are the part that answers March.
One boundary before the numbers stop. Every figure above is dated, and the most recent window ends in July 2025. This page makes no claim about how the account is trading today - ask on the call and we will tell you.
Want to know what this would look like on your numbers? Start with a free 30-minute Strategy Call: the $5,000 Profit Clarity Audit rebuilds your real CAC, contribution margin and blended MER outside the ad platforms, in 14 days.
Verify this case study
- Most of the numbers on this page come off one page of our client deck, dated 4 September 2026. That page holds the two Shopify screenshots and the Triple Whale panel reproduced above. Five do not: October and December 2024, June 2025 at €363,866, the €8,431,427 year to July 2025, and our own Shopify reading of November 2024. The Q4 total and the non-Q4 average are arithmetic on those. All of them come from our internal reconciliation of BALOLO's Shopify, Meta, Google and Triple Whale data. They are labelled where they appear. Two of the three deck screenshots are dated Shopify months. The first reads 1 Nov to 30 Nov 2022, total sales €158,610.41. The second reads 1 Nov to 30 Nov 2023, total sales €1,049,044.98, with a 561% badge against the prior year. The engagement start date, 1 August 2022, comes from our client roster.
- The third screenshot is a Triple Whale summary panel, and it carries no date label. Its date control reads Last Month. We tie it to November 2024 through the Facebook Ads tile of €165,779.10. That matches the Meta spend in our own November 2024 reconciliation. The panel reads order revenue €1,569,542.17, ads €288,918.86, MER 18.41%, 5,217 orders and true AOV €273.96. It carries three ROAS tiles, not one: a blended 5.43, a Google tile at 7.76 and a Meta tile at 5.79. The 5.43 is the one this page uses. It is order revenue divided by total ad spend, and it is the lowest of the three.
- Three things in that evidence do not tie out cleanly. We are naming them because reconciling exactly this is the work. Dashboards disagree with each other and with the bank. Somebody has to say which number is which. The Facebook and Google tiles fall €375.98 short of the ads total. A small amount of spend sits outside those two channels. 5,217 orders at €273.96 comes to about €1.43 million, not €1.57 million. The panel's true AOV is not order revenue divided by orders. We do not know which figures the panel is netting out, and we will not guess in print. It does not move the 5.43. That comes from the order revenue and the ad spend, two tiles on the same panel. And our own Shopify record for November 2024 reads €1,537,823, about 2% under the panel. We print the panel figure because the deck is our source of record. One more seam. The €3,206,333 Q4 total uses that Shopify November. Add the three months as printed here and you get €3,238,052 instead.
- The two images above are the evidence panels from that deck page. We cropped the Shopify pair out of a larger deck graphic, which cuts the deck's own headline off the top - the red fragment at the top is what is left of the arrow between the two cards. Nothing inside the two charts was changed. That headline rounds the figures. It reads 'From €160k/Month To €1M/Month In 12 Months'. We have printed the screenshot numbers instead, €158,610.41 and €1,049,044.98. Those are the ones you can read off the charts. The deck page itself is titled 'To €1,5M/month at a 5,43X ROAS'. That reads as a monthly rate. It was one month, November 2024. The figures above are why we say so. Ask on your Strategy Call and we will walk you through exactly what is verifiable and what is not. The dating boundary above stands: the most recent figure is July 2025, and this page makes no claim about today.
Run the same math on your own account
Every HoloGrowth engagement starts with the same five numbers: CM3, nCAC, 90-day LTGP:CAC, payback, and new-vs-returning split. The free Scaling Scorecard gives you those five metrics with the exact scale/hold/fix/kill thresholds we use on managed accounts - so you can see the same picture before you ever talk to us. If you only want to run one number first, find the point where your next dollar of spend stops being profit with the ad spend ceiling calculator.
Get the Free Scaling ScorecardYour March can look like your November - if something other than the calendar is deciding it.
It starts with a free 30-minute Strategy Call - we clarify your numbers, name your most likely constraint live, and decide together what makes sense next. Double-backed: 100% money-back if it wasn't clearly worth it, or the full fee becomes a credit if we can't quantify $75K in annual profit upside.